Stat Sentry's icon: an owl whose eyes are two gauges Stat Sentry
For Macs with Apple silicon

Your Mac, on watch.

Stat Sentry keeps CPU, memory, temperatures, drives, network and your AI agents in the menu bar, and warns you before something runs out.

$7.99, once. No subscription. macOS 26 or later.

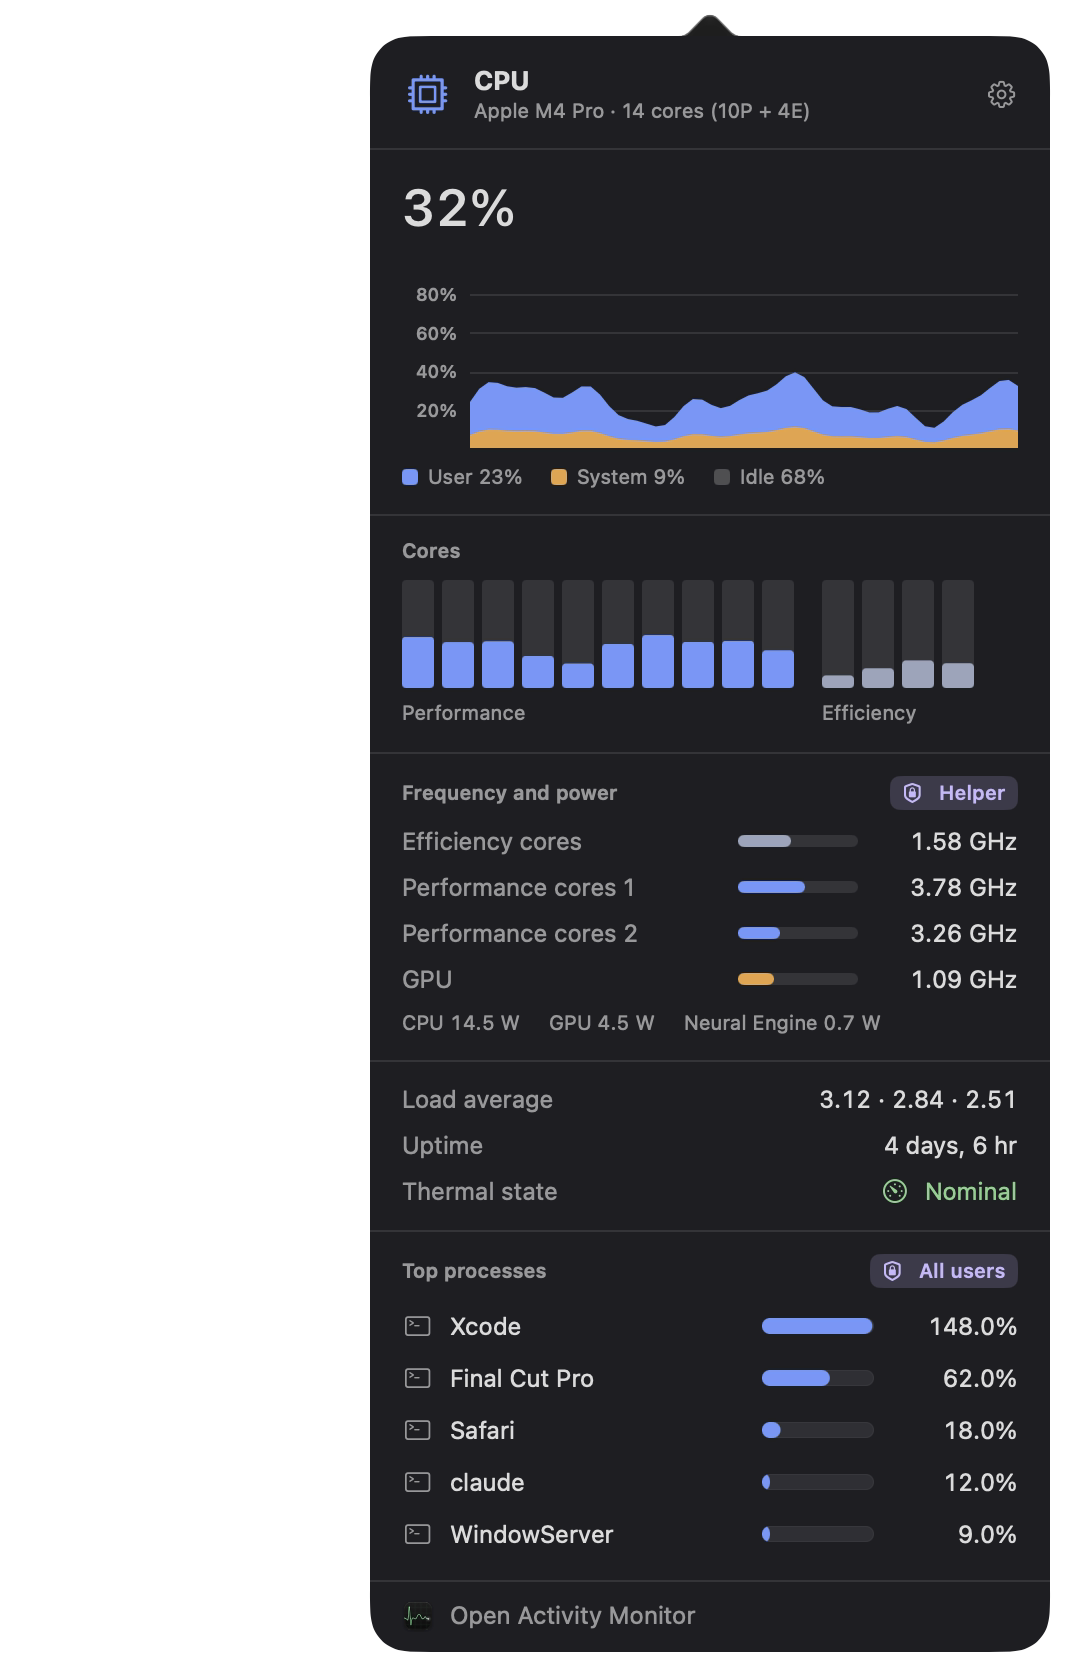
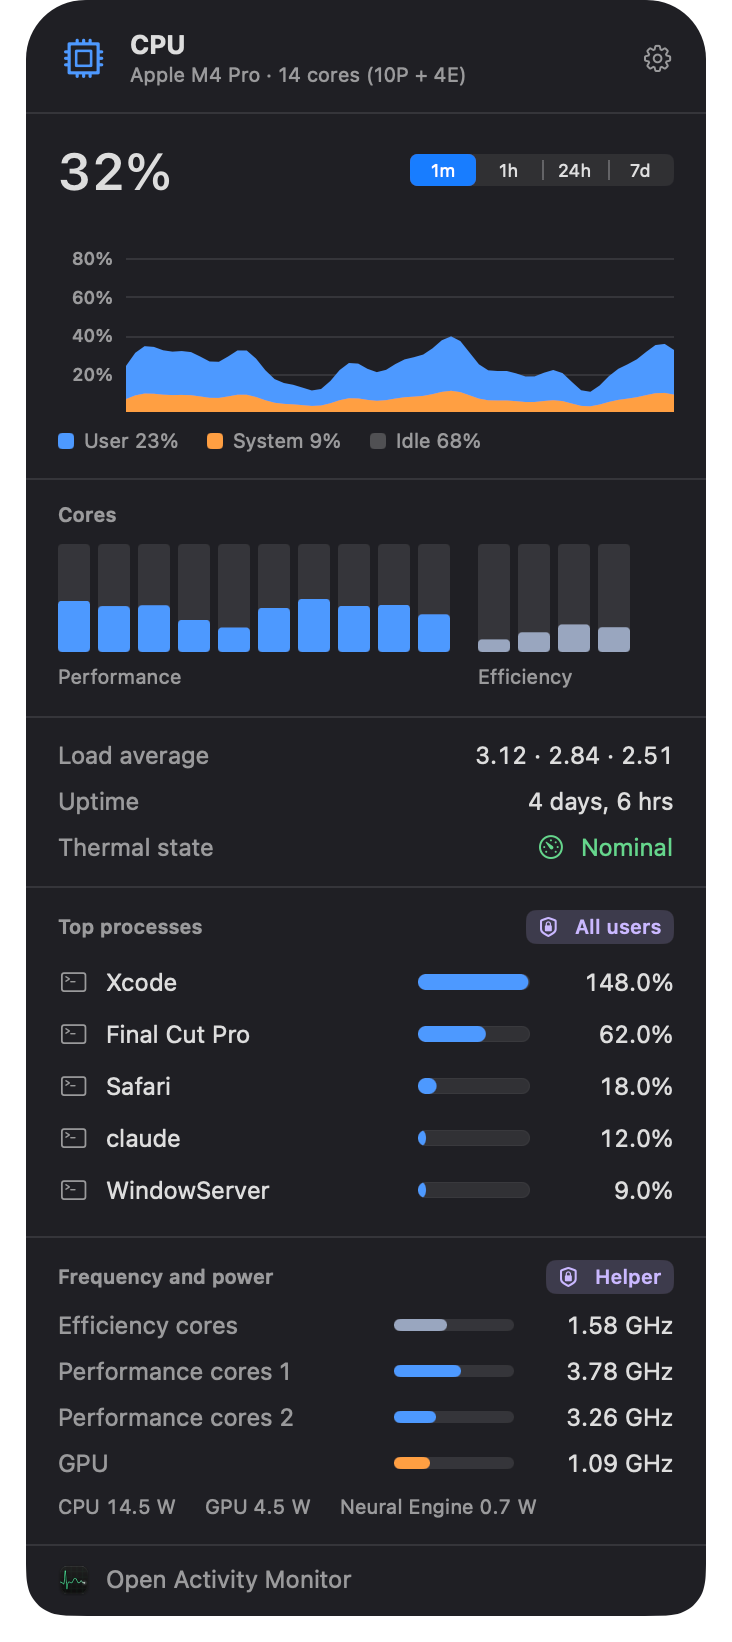
The CPU panel, open below its menu bar item: 32% busy on an Apple M4 Pro, a minute of load history, bars for 10 performance and 4 efficiency cores, load average, uptime, thermal state, and the top processes.
Six panels, one click each

Everything your Mac is doing, at a glance.

Each part of your Mac gets a menu bar item and a panel. Show the ones you care about; hidden ones aren't measured at all, so Stat Sentry stays light.

The CPU panel: load history, per-core bars for performance and efficiency cores, and top processes.
CPU & GPU

Every core, at a glance.

The CPU panel splits performance and efficiency cores, so you can tell a busy build from a busy background task.

  • A minute of load history, with user and system time
  • One bar per core, performance and efficiency apart
  • Load average, uptime and thermal state, with throttling shown
  • The processes using the most CPU, every user's with the Helper
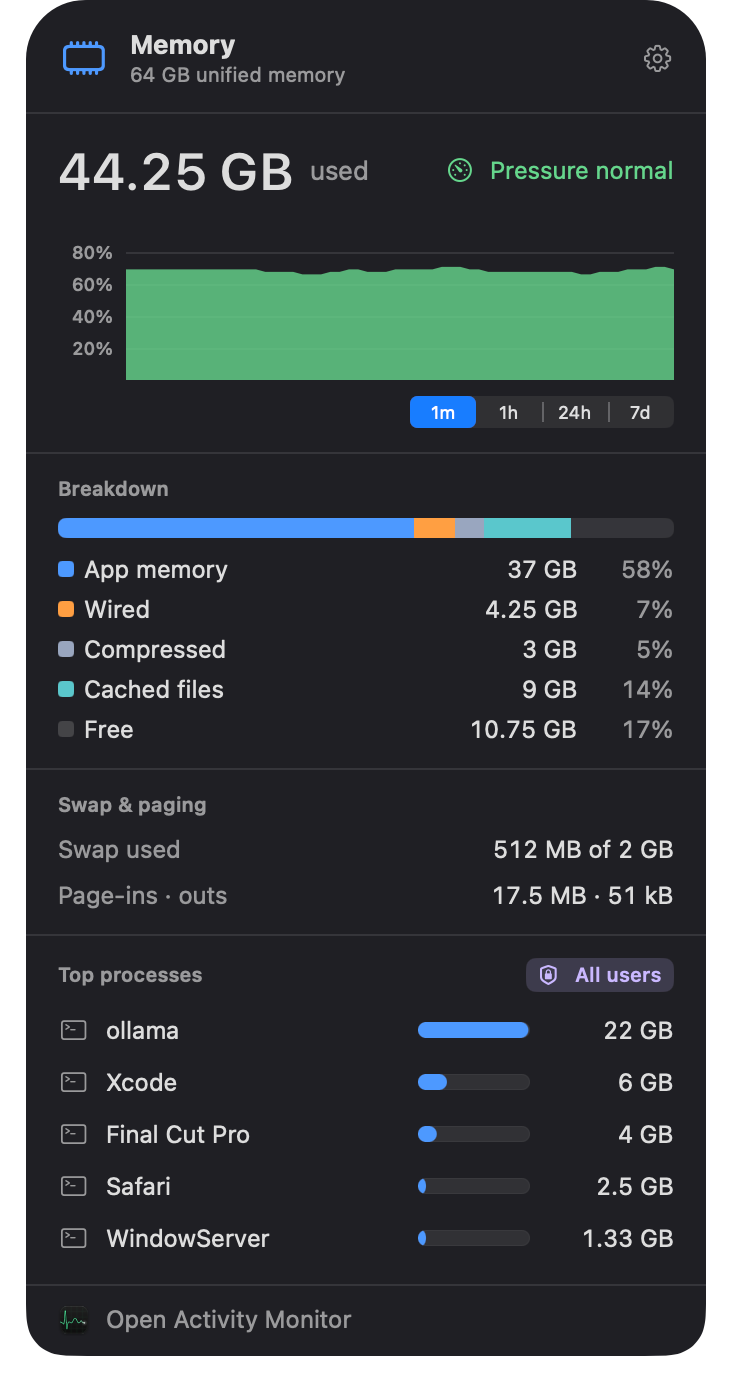
The Memory panel: 44.25 GB used with normal pressure, a breakdown of memory, swap and the biggest users.
Memory

The number that matters: pressure.

Used memory alone doesn't say much on a Mac. Stat Sentry shows what macOS itself goes by: memory pressure, and what makes it up.

  • Pressure, and how full memory has been over the last minute
  • App memory, wired, compressed, cached files and free, as a bar and in numbers
  • Swap in use, and pages read from and written to disk
  • Who's holding the most, so a runaway app or a large model stands out
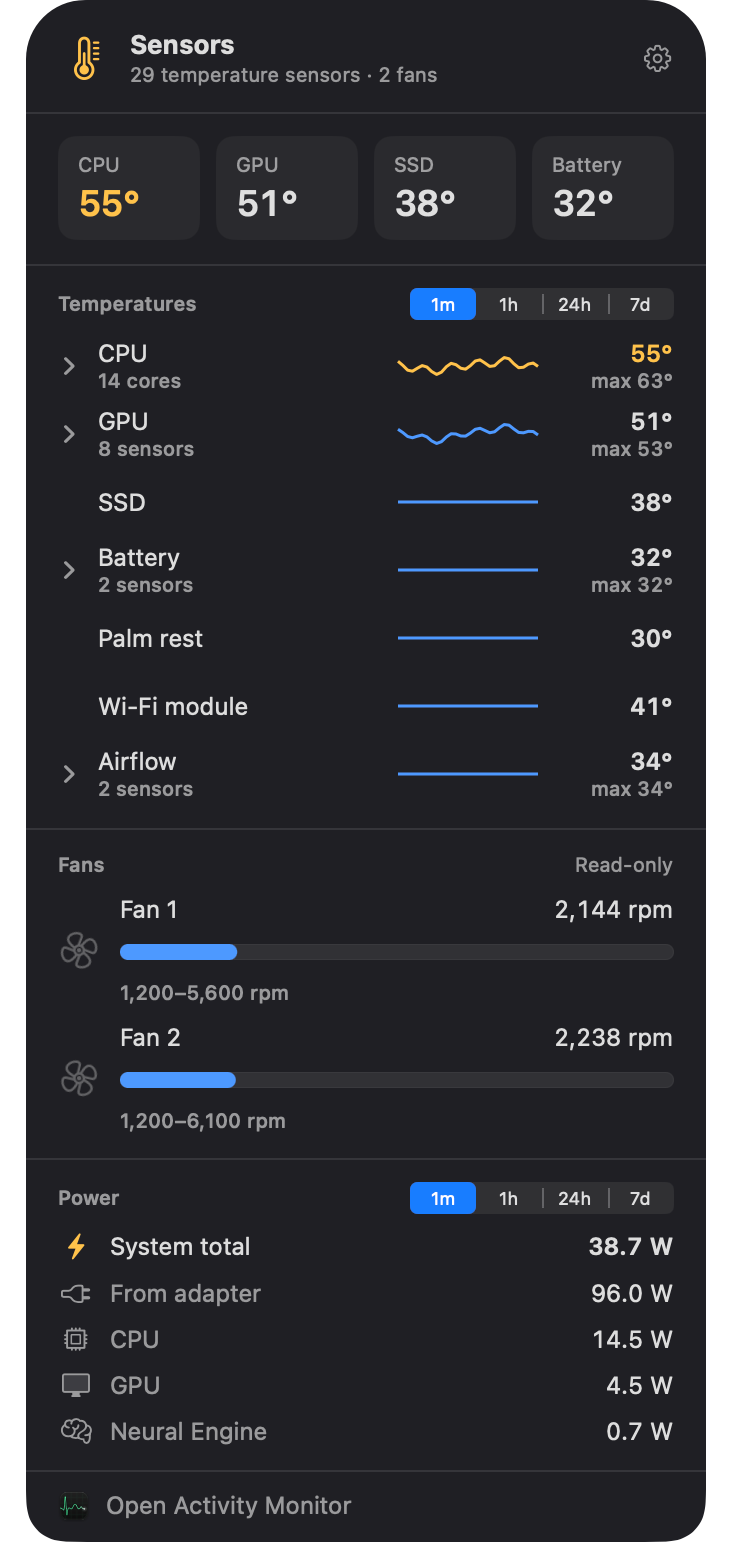
The Sensors panel: average CPU, GPU, SSD and battery temperatures, sensor groups with trend lines, two fans and power draw.
Sensors

Temperatures with real names.

Apple doesn't say which sensor is which. Stat Sentry names them for each chip, so you see “Performance core 3”, not “Tp0D”. They come from the optional Helper.

  • CPU, GPU, SSD, battery, palm rest, Wi-Fi module and airflow, each with a trend line
  • Expand a group to see every sensor in it, and its highest reading
  • Fan speeds against their minimum and maximum
  • Power: what the whole Mac draws, and what the adapter delivers
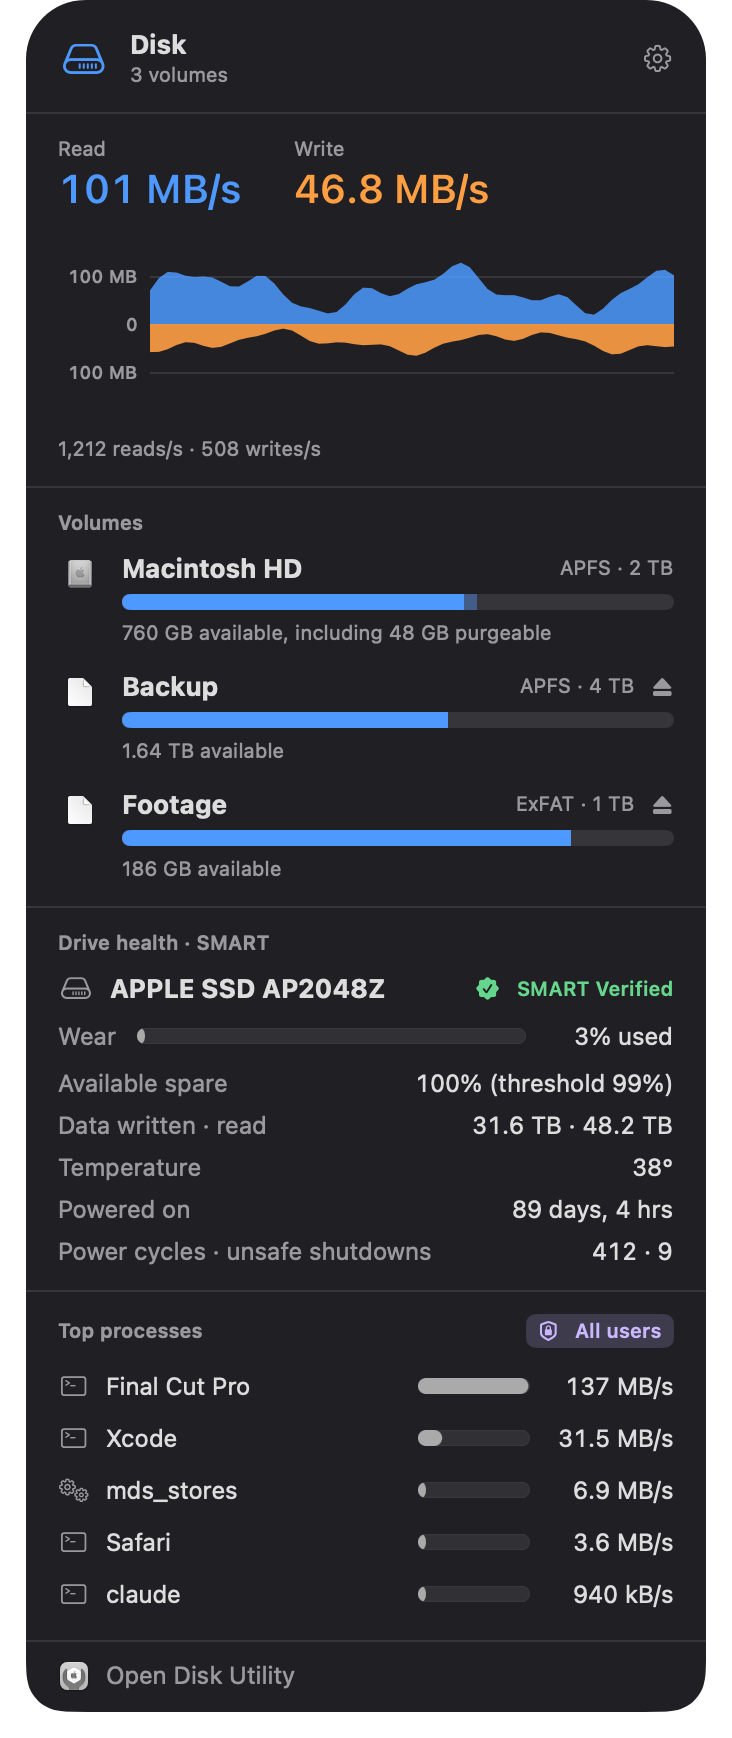
The Disk panel: read and write rates, three volumes with free space, SMART health of the SSD, and processes by disk use.
Disks

Space, speed and health.

Free space with purgeable space counted, live read and write speed, and the SMART health of your SSD, all in one panel.

  • Read and write speed, mirrored in one graph, with operations per second
  • Every volume's free space, internal and external, with one-click eject
  • SMART health: wear, spare blocks, data written, hours powered on, unsafe shutdowns
  • The processes reading and writing the most, with the Helper
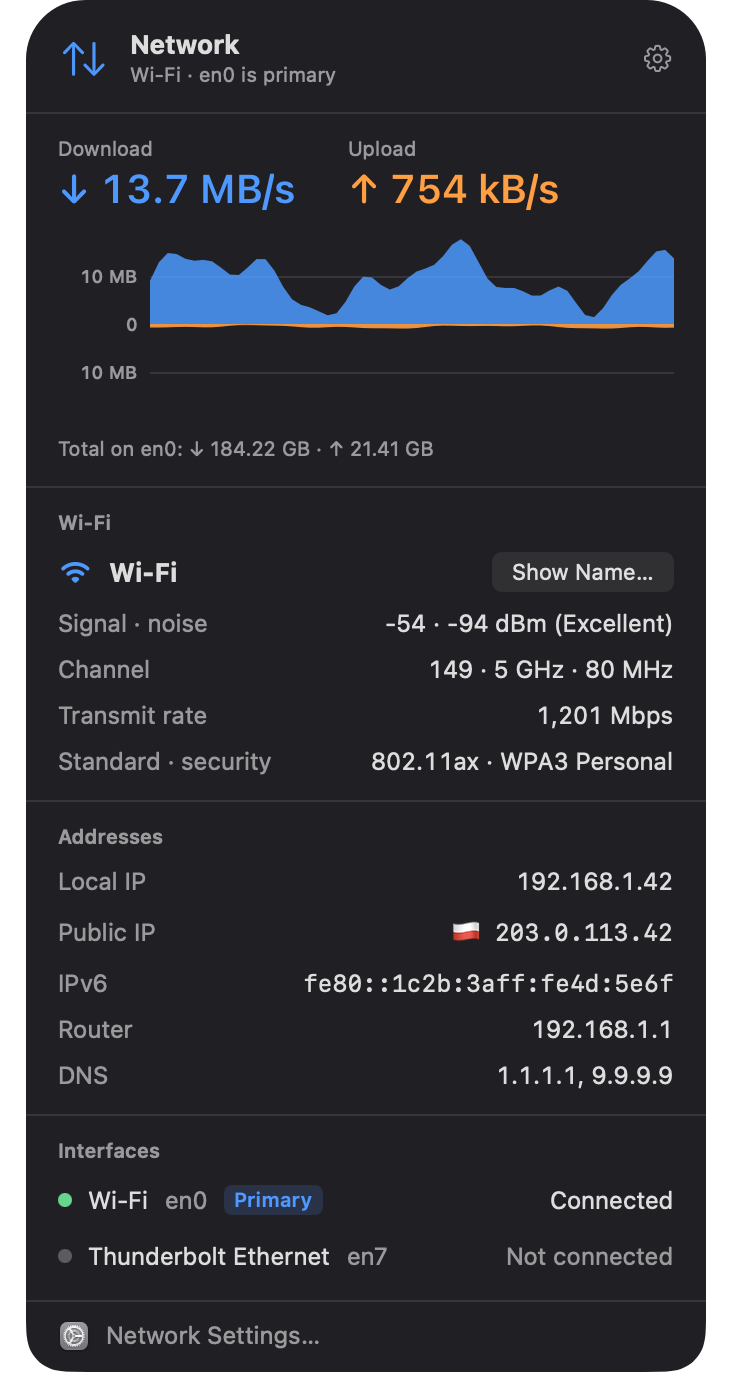
The Network panel: download and upload speed, Wi-Fi details, addresses with the public IP's country, and interfaces.
Network

What your Mac is sending, and where.

Traffic on the connection in use, the Wi-Fi link's quality, and every address, including your public IP and its country if you turn that on.

  • Download and upload speed, and totals since the Mac started
  • Wi-Fi signal and noise, channel and band, transmit rate, standard and security
  • Local and public IP with a country flag, IPv6, router and DNS
  • Every interface, and which one is carrying traffic
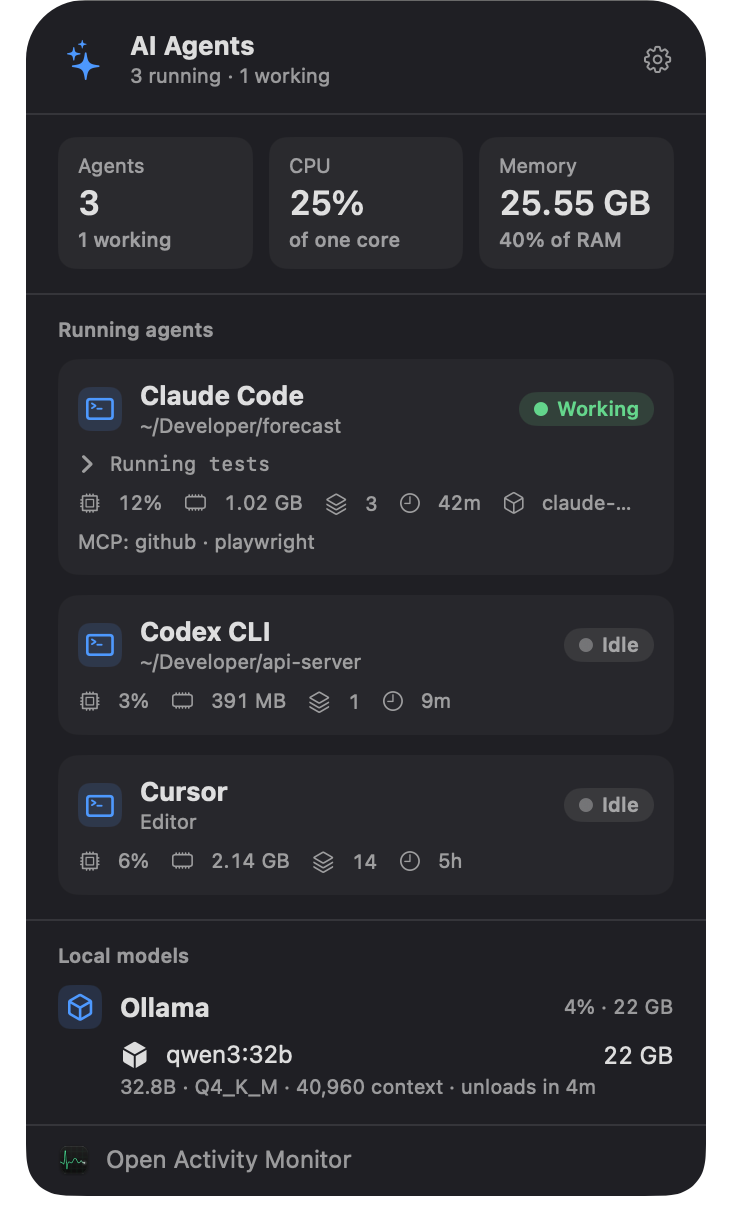
The AI Agents panel: Claude Code working in a project with two MCP servers, Codex and Cursor idle, and a Qwen model loaded in Ollama.
AI agents New

Know what your agents are doing.

Something no other monitor shows: the coding agents and local models running on your Mac, and what they cost it.

  • Claude Code, Codex, Gemini CLI, Cursor, Copilot, Aider and more, found by themselves
  • Working or idle, the project folder, CPU, memory, processes and how long they've run
  • Their MCP servers, by name
  • Models loaded in Ollama: size, quantization, context length, and when they unload
Widgets New

Watch from the desktop, too.

Put Stat Sentry on your desktop or in Notification Center, in any widget size. Choose what each widget shows. Click a module to open its panel.

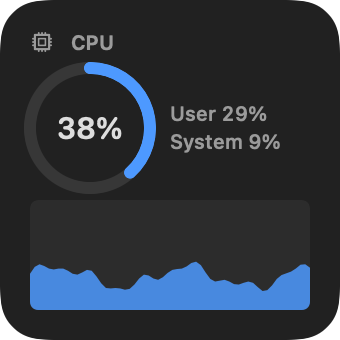
  • Small: one module, with a ring for CPU or memory and a minute of history
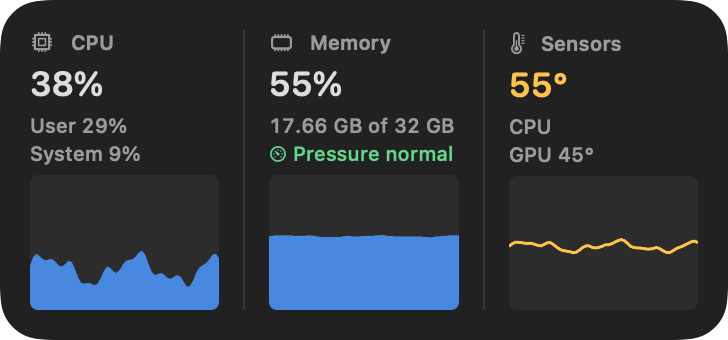
  • Medium: up to three modules side by side
  • Large and extra large: graphs for up to six modules, the busiest processes and temperatures
  • In your color scheme, and in macOS's tinted and accented widget styles

Stat Sentry measures only what your widgets show, and refreshes them at most every few seconds, so they stay light.

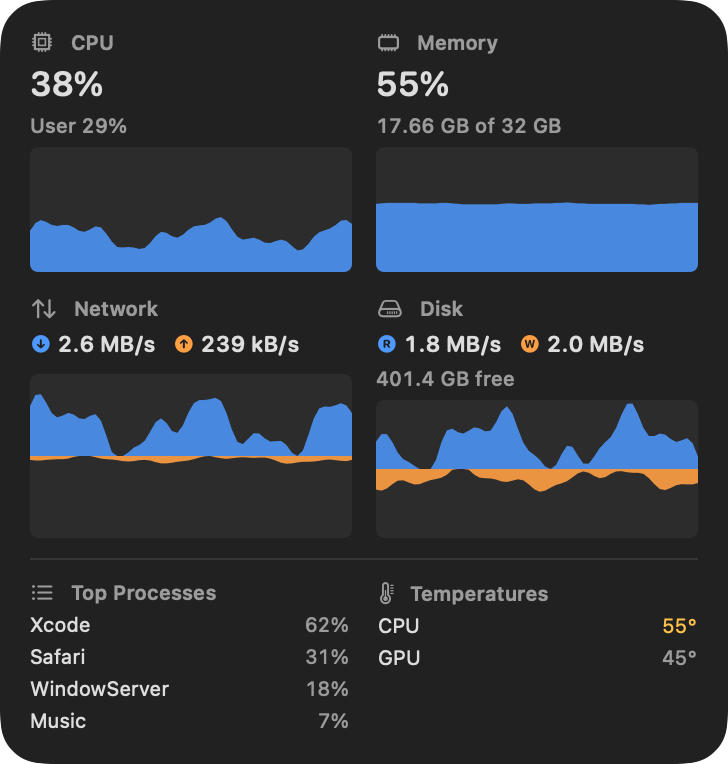
A large Stat Sentry widget: CPU at 38%, memory at 55%, network and disk graphs, the top processes and CPU and GPU temperatures.
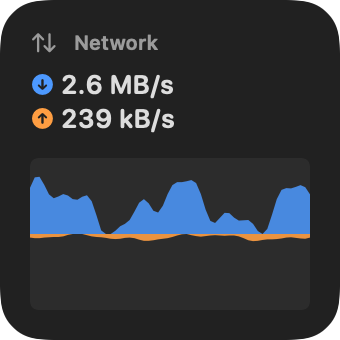
A small widget: CPU at 38% in a ring, with user and system time and a minute of history. A medium widget with CPU, memory and temperature side by side, each with its history. A small widget: download at 2.6 MB/s and upload at 239 kB/s, with a minute of history.
Alerts

Know before your Mac runs out.

Set rules for memory, swap, disk space, drive health, the network, or temperature with the Helper. Stat Sentry notifies you, tints the menu bar item, and opens the right panel when you click.

  • A local model about to exhaust memory gets a critical alert, with what's holding it.
  • Find out when an agent finishes a long task.
  • Thresholds in your units, a delay before it fires, and how often to remind you.
Make it yours

Your menu bar, your way.

Each item can show an icon, a value, a label, a graph or a bar, stacked or side by side, in any order. Hide what you don't need: hidden panels and sections aren't measured at all, so Stat Sentry stays light.

Standard
Ocean
Sunrise
Ember
Crimson
Grape
Orchid
Midnight
Forest
Graphite
Stat Sentry Helper

Optional, free, read-only.

Some readings need administrator access, so they come from a small, separate Helper that runs as a system service. With it, Stat Sentry shows temperatures, fans and power, and every user's processes, including WindowServer and kernel_task. Without it, everything else works as usual.

Private by design

Nothing leaves your Mac.

No account, no analytics, no tracking. Stat Sentry measures on your Mac and keeps it there. It only goes online when you ask: to look up your public IP, or to send a problem report you've read first.

One price
$7.99

Pay once on the Mac App Store. Updates are free, and nothing is locked behind a subscription.